
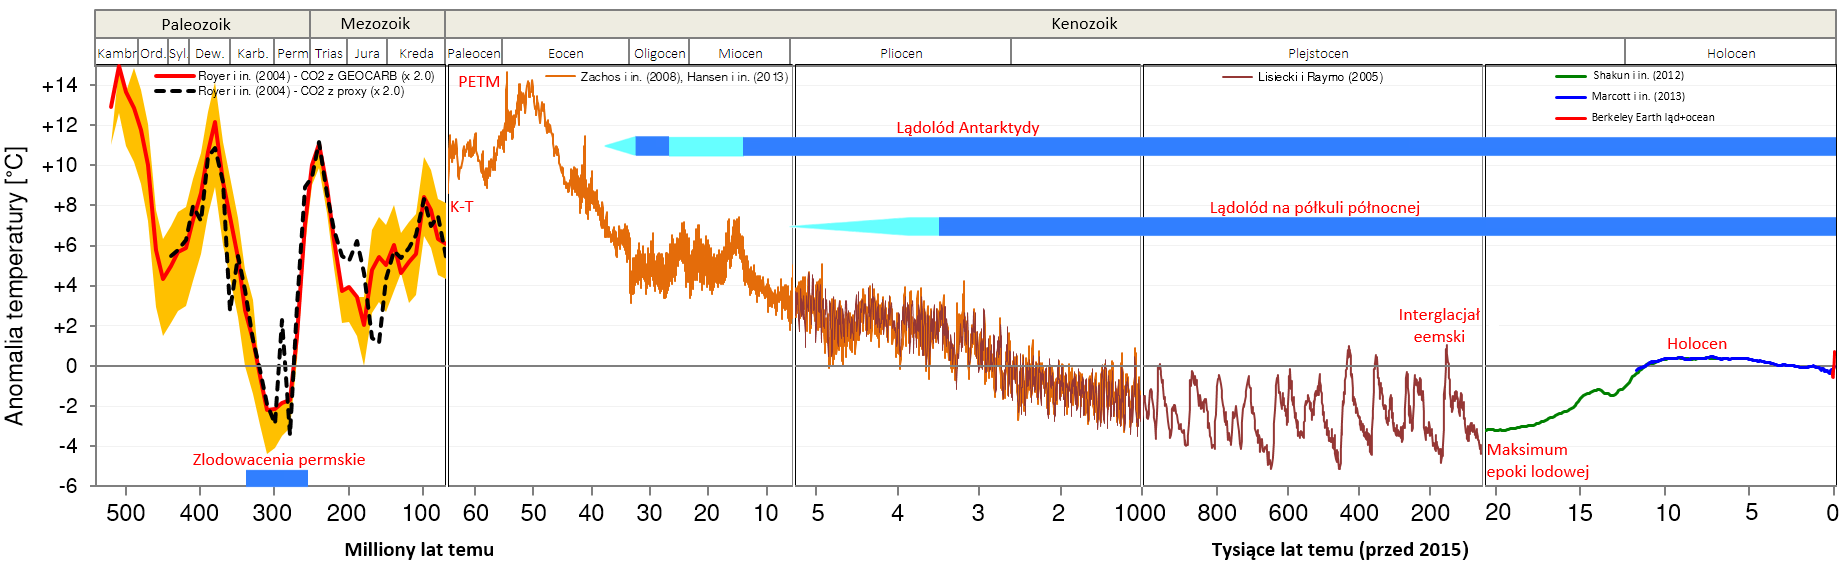
Oszacowania zmian średniej temperatury powierzchni Ziemi w ostatnich 65 mln lat względem okresu bazowego 1961–1990 (średnia temp. Ziemi ok. 14°C). Niebieskie linie oznaczają epizody zlodowaceń, pola jasnoniebieskie pokazują częściowe zlodowacenie, pola ciemnoniebieskie trwałe. Zaznaczone są kluczowe zdarzenia omówione w tekście. Grafika własna. Kliknij, aby powiększyć.
Źródła: Fergus, G., Global average temperature estimates for the last 540 My, Wikipedia [https://bit.ly/2iMkWya] Panel 1: 540-65 Mya. Veizer, J. i in., 87Sr/86Sr, d13C and d18O evolution of Phanerozoic seawater, „Chem. Geol.”, 1999 [https://bit.ly/2EgydaL]; Royer, D.L. i in., CO2 as a primary driver of Phanerozoic climate, „GSA Today”, 2004 [https://bit.ly/2DYNDB2].Panel 2: 65-5,3 Mya. Hansen, J. i in., Climate sensitivity, sea level, and atmospheric carbon dioxide, „Phil. Trans. R. Soc. A.”, 2013 [https://bit.ly/2Badik8]; Zachos, J.C., Dickens, G.R., Zeebe, R.E., An Early Cenozoic perspective on greenhouse warming and carbon-cycle dynamics, „Nature”, 2008 [https://bit.ly/2FJYN98]; Zachos, J.C. i in., Extreme warming of mid-latitude coastal ocean during the Paleocene-Eocene Thermal Maximum: Inferences from TEX86 and isotope data, „Geology”, 2006 [https://bit.ly/2FLaPzp]. Panel 3: 5,3-1 Mya. Lisiecki, L.E., Raymo, M.E. A Pliocene-Pleistocene stack of 57 globally distributed benthic δ18O records, „Paleoceanography”, 2005 [https://bit.ly/2EaVefl]; Lisiecki, L.E., Raymo, M.E., Correction to A Pliocene-Pleistocene stack of 57 globally distributed benthic δ18O records, „Paleoceanography”, 2005 [https://bit.ly/2nFaJ4E]; Hansen, J. i in., Climate sensitivity, sea level, and atmospheric carbon dioxide, „Phil. Trans. R. Soc. A.”, 2013 [https://bit.ly/2Badik8]. Panel 4: 1 Mya-20 000 ya. Jouzel, J. i in., EPICA Dome C ice core 800kyr deuterium data and temperature estimates, IGBP PAGES, 2007 [https://bit.ly/2GI17yR]; Jouzel, J. i in., Orbital and millennial Antarctic cimate variability over the past 800,000 years, „Science”, 2007 [https://bit.ly/2BVNKHU]. Panel 5: 20 000 ya-teraz. Andersen, K.K. i in., High-resolution record of Northern Hemisphere climate extending into the last interglacial period, „Nature”, 2004 [https://bit.ly/2nJY9RE]; Johnsen, S.J., Dansgaard, W., White, J.W.C., The origin of Arctic precipitation under present and glacial conditions, Tellus B, 1989 [https://bit.ly/2GMKvWE]; Marcott, S.A. i in., A reconstruction of regional and global temperature for the past 11,300 years, Science, 2013 [https://bit.ly/2FINgqZ]; Instrumental data since 1850, Berkeley Earth project land-ocean dataset, 2014 [https://bit.ly/2zMebiY]; Summary for Policymakers [https://bit.ly/w:] WG1: Climate Change 2013, The Physical Science Basis, IPCC, AR5, 2013 [https://bit.ly/2lXEpJB]
Fajnie, że tu jesteś. Mamy nadzieję, że nasz artykuł pomógł Ci poszerzyć lub ugruntować wiedzę.
Nie wiem, czy wiesz, ale naukaoklimacie.pl to projekt non-profit. Tworzymy go my, czyli ludzie, którzy chcą dzielić się wiedzą i pomagać w zrozumieniu zmian klimatu. Taki projekt to dla nas duża radość i satysfakcja. Ale też regularne koszty. Jeśli chcesz pomóc w utrzymaniu i rozwoju strony, przekaż nam darowiznę w dowolnej wysokości


